Quantitative model
1. Find Pivot Point and Price Channel

Retrieve Historical Data from the FiinQuant Library
from FiinQuantX import FiinSession
import pandas as pd
import numpy as np
import plotly.graph_objects as go
from scipy import stats
username = 'YOUR_USERNAME'
password = 'YOUR PASWORD'
client = FiinSession(
    username=username,
    password=password
).login()


data = client.Fetch_Trading_Data(
    tickers='VCB',
    fields=['open', 'high', 'low', 'close', 'volume'],
    adjusted=True,
    period=1000,
    realtime=False,
    by='1d',
).get_data()
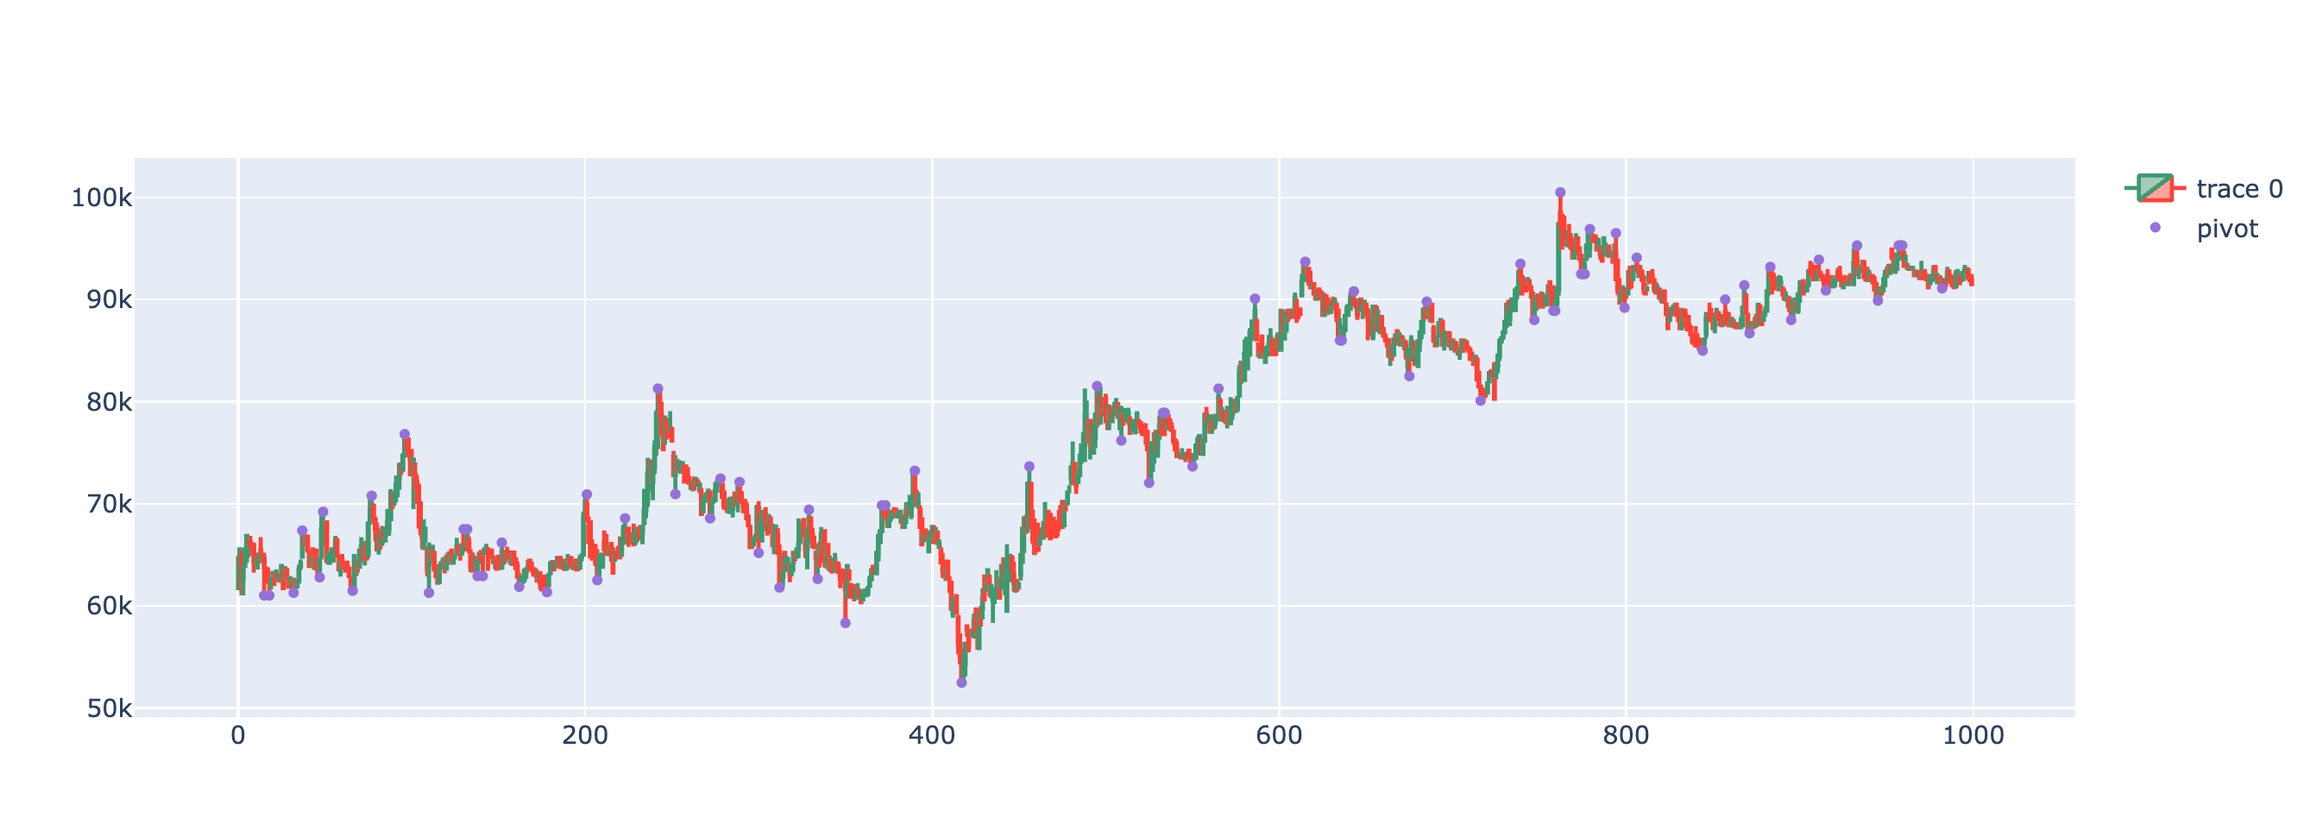
Find Pivot Point and plot stock prices
# Function to identify pivot points in price data
# Returns: 0 for no pivot, 1 for pivot high, 2 for pivot low, 3 for both
# Parameters:
#   candle: index of the current candle being checked
#   window: number of candles to check on either side
def isPivot(candle, window):
    if candle-window < 0 or candle+window >= len(data):
        return 0

    pivotHigh = 1
    pivotLow = 2
    for i in range(candle-window, candle+window+1):
        if data.iloc[candle].Low > data.iloc[i].Low:
            pivotLow=0
        if data.iloc[candle].High < data.iloc[i].High:
            pivotHigh=0
    if (pivotHigh and pivotLow):
        return 3
    elif pivotHigh:
        return pivotHigh
    elif pivotLow:
        return pivotLow
    else:
        return 0

# Apply isPivot function to each row of data
window=10
data['isPivot'] = data.apply(lambda x: isPivot(x.name,window), axis=1)

# Function to determine plotting position for pivot points
# Returns slightly offset values for visual clarity on the chart
# Parameters:
#   x: row of dataframe containing price and pivot information
def pointpos(x):
    if x['isPivot']==2:
        return x['Low']-1e-3  # Offset below pivot low
    elif x['isPivot']==1:
        return x['High']+1e-3 # Offset above pivot high
    else:
        return np.nan

# Apply pointpos function to create plotting positions
data['pointpos'] = data.apply(lambda row: pointpos(row), axis=1)


# Create candlestick chart
dfpl = data.copy()
fig = go.Figure(data=[go.Candlestick(x=dfpl.index,
                open=dfpl['open'],
                high=dfpl['high'],
                low=dfpl['low'],
                close=dfpl['close'])])

fig.add_scatter(x=dfpl.index, y=dfpl['pointpos'], mode="markers",
                marker=dict(size=5, color="MediumPurple"),
                name="pivot")

fig.update_layout(xaxis_rangeslider_visible=False)

fig.show()
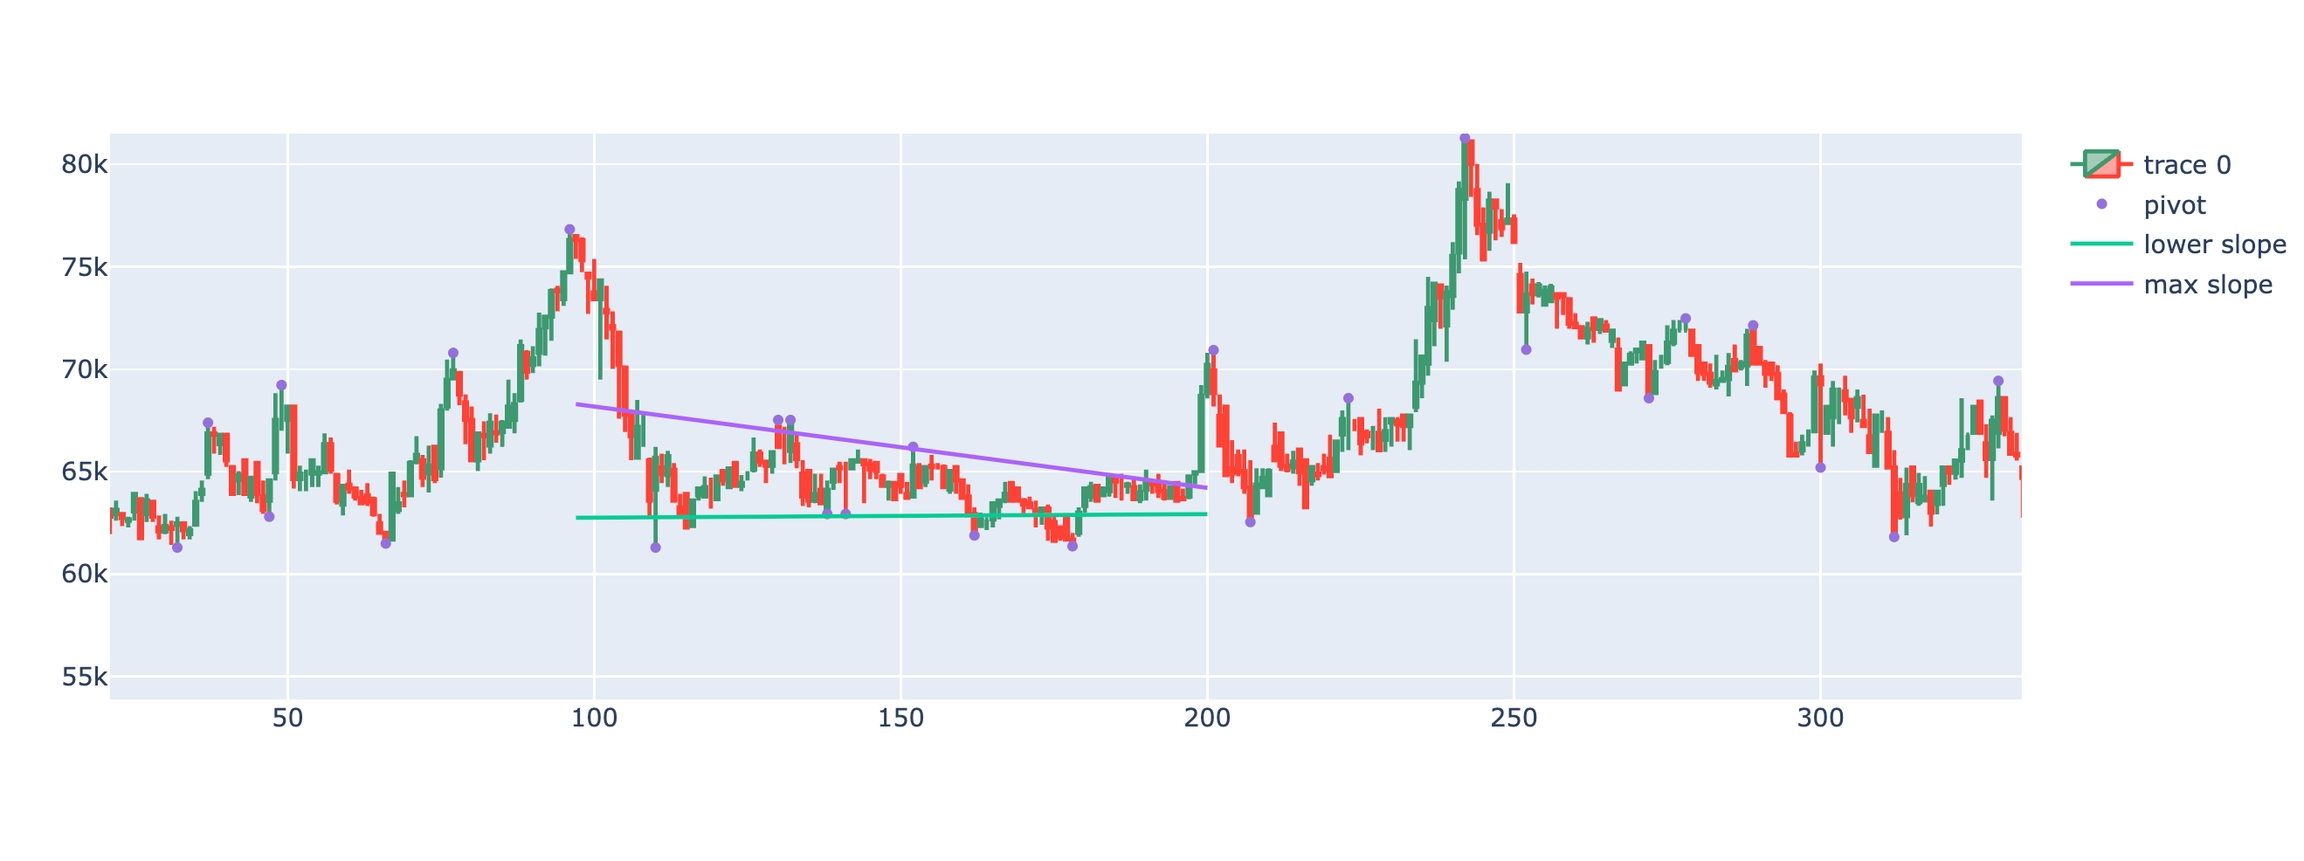
Find Price Channel based on Pivot Point

# Function to identify and calculate channel slopes using pivot points
# Parameters:
#   candle: Current candle position to analyze from
#   backcandles: Number of previous candles to look back
#   window: Window size for pivot point calculation
def collect_channel(candle, backcandles, window):
    # Get subset of data for analysis
    localdf = data[candle-backcandles-window:candle-window]
    localdf['isPivot'] = localdf.apply(lambda x: isPivot(x.name,window), axis=1)

    # Extract pivot highs and lows with their indices
    highs = localdf[localdf['isPivot']==1].High.values
    idxhighs = localdf[localdf['isPivot']==1].High.index
    lows = localdf[localdf['isPivot']==2].Low.values
    idxlows = localdf[localdf['isPivot']==2].Low.index

    # Calculate regression lines if enough pivot points exist
    if len(lows)>=2 and len(highs)>=2:
        # Calculate regression for lower channel (pivot lows)
        sl_lows, interc_lows, r_value_l, _, _ = stats.linregress(idxlows,lows)
        # Calculate regression for upper channel (pivot highs)
        sl_highs, interc_highs, r_value_h, _, _ = stats.linregress(idxhighs,highs)

        return(sl_lows, interc_lows, sl_highs, interc_highs, r_value_l**2, r_value_h**2)
    else:
        return(0,0,0,0,0,0)

# Set parameters for channel analysis
candle = 200          # Current candle position
backcandles = 100     # Number of candles to look back
window = 3            # Window size for pivot calculation

# Create candlestick chart
fig = go.Figure(data=[go.Candlestick(x=dfpl.index,
                open=dfpl['open'],
                high=dfpl['high'],
                low=dfpl['low'],
                close=dfpl['close'])])

# Add pivot points to chart
fig.add_scatter(x=dfpl.index, y=dfpl['pointpos'], mode="markers",
                marker=dict(size=5, color="MediumPurple"),
                name="pivot")

# Calculate channel slopes and angles
sl_lows, interc_lows, sl_highs, interc_highs, r_sq_l, r_sq_h = collect_channel(candle, backcandles, window)
print(sl_lows,sl_highs)
angle_lows = np.degrees(np.arctan(sl_lows))
angle_highs = np.degrees(np.arctan(sl_highs))

# Plot channel lines
x = np.array(range(candle-backcandles-window, candle+1))
fig.add_trace(go.Scatter(x=x, y=sl_lows*x + interc_lows, mode='lines', name='lower slope'))
fig.add_trace(go.Scatter(x=x, y=sl_highs*x + interc_highs, mode='lines', name='max slope'))
fig.update_layout(xaxis_rangeslider_visible=False)
fig.show()Last updated